


In my defense, I was only supposed to write one book on minerals.
I was finishing my book The War on Chlorine Dioxide last August when a colleague named Kacper Postawski (now on Substack), who, in 2016, made Quantum Leap, the first major documentary on chlorine dioxide, began telling me about a unique aqueous mineral solution he had encountered, extracted from volcanic rock. He thought I might be interested in studying it, given my work on chlorine dioxide.
He also attached a number of health claims to it, which I quickly filed under the category of yet another promising, unstudied therapeutic—a category I was somewhat, though not completely, getting tired of.
I mean, heck, at that point, my partner Scott Marsland and I at the Leading Edge Clinic had already spent almost four years going down at least 30 research rabbit holes trying to identify therapies for our chronic Covid and Covid vaccine-destroyed patients: hyperbaric oxygen therapy, stem cells and exosomes, IV methylene blue, near-infrared saunas, pulsed electromagnetic field therapy mats, brain retraining, peptides, vagal nerve stimulators, qEEG neurofeedback, ozone therapy, EBOO, IVIG, plasmapheresis, ultraviolet blood irradiation, DMSO, chlorine dioxide, plus the pill boxes and/or IV drips filled with varying flavors of vitamins and nutraceuticals.
The list was dizzying. They all worked, to one degree or another, but only a few were consistent, durable, and affordable enough—all at once—to become foundational to our clinic’s approach or, more specifically, to lead me to write about them here on Medical Musings (and I have only written about a few; Scott has written way more on his Substack).
Basically, I found that each one fell under the maxim: “Everything works in someone, but nothing works in everyone.” I suppose you could say that about every therapeutic, but along that continuum, I was drawn to—and constantly trying to identify—the therapies that came much closer to working in everyone while remaining safe, inexpensive, and widely available. The really expensive, occasionally more potent clinic-based treatments were often hit-or-miss propositions. When you recommended one, and it hit, great; when it was a miss, the patient paid for it, both literally and metaphorically.
Kacper told me just enough about the aqueous mineral solution to make me curious—and no more than he needed to, I think, because he understood that the curiosity the mineral story would trigger would carry me the rest of the way.
At the time, I was also deep into the early chapters of a book on daily low-dose sublingual ketamine—a treatment that regrows nerves, rebuilds synapses, and reverses diseases that neurology and psychiatry have never been able to reverse, yet almost nobody in medicine is using correctly. That book was going well, but the minerals pulled harder.
What began as a question about one unusual extract from a Japanese volcanic rock became, eleven months later, three books—a trilogy built around a single subject: water, minerals, and the cyclic architecture that connects them. Towards the end, the investigation led me to Japan and to a dinner hosted in my honor by a Nobel laureate. I still can’t believe I just wrote that sentence.
That evening is not only the finest moment of my chaotic life since Covid; it is one of the finest moments of my entire life. His gift of a calligraphy he had made for me in Japanese characters of his favorite phrase, “There are no chance encounters. Everything happens for a reason,” is one I will cherish forever, and if you have read The Blueprint of Life, you will know it carried more meaning than he will ever know. Anyway, I cannot wait to share the story of the afternoon and evening that my wife Lisa and I spent with Professor Omura and his team. Now that I am finally emerging from underneath these books, it will come soon, I promise.
Into Freer Air
Above all, I am seriously giddy about something I have never gotten to experience as a book author: these books are the first in my career that I do not expect to be targeted by the censors.
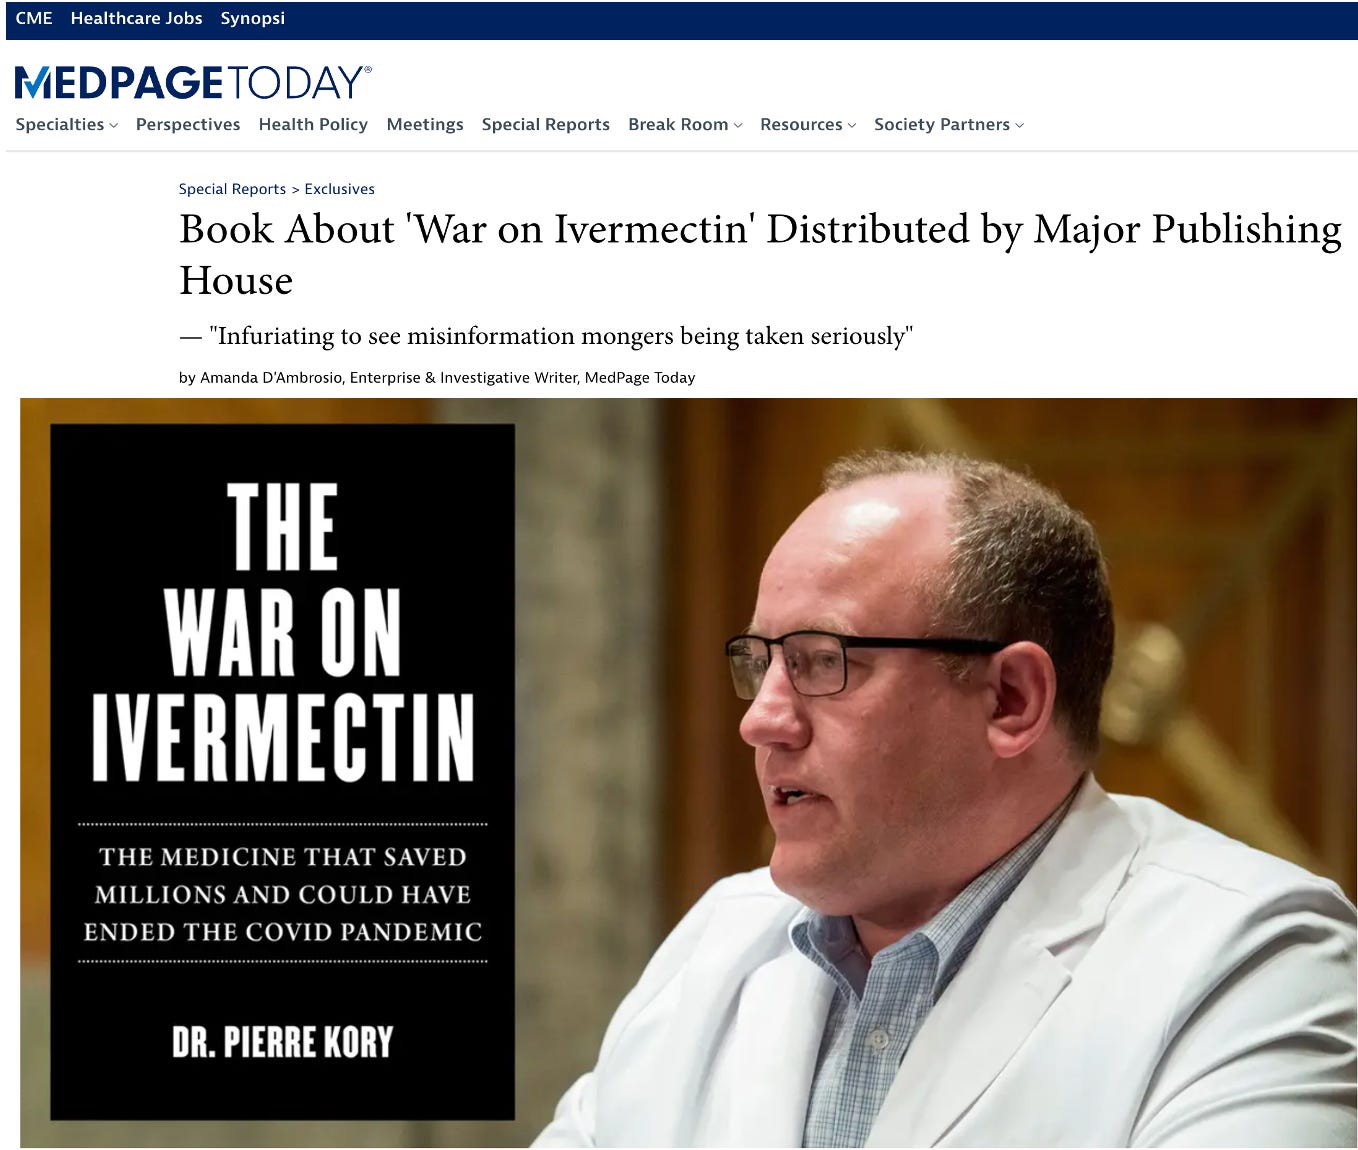
My first book, The War on Ivermectin, was not picked up by a single library or book store (“we don’t carry those kinds of books”), and only attracted a few scattered hit-job reviews in Pharma-funded industry rags like MedPage Today, with the subtitle “Infuriating to see misinformation mongers being taken seriously”:
My second, The War on Chlorine Dioxide, I knew not to even bother listing on Amazon. Senator Ron Johnson, however, did manage to earn a hit piece from the book, simply because he wrote the blurb on the cover, which I thought was an awesome one: “A gripping tale of corruption and courage that will open eyes and prompt serious questions.” Fun fact: I have sent Ron three of my books, and each time, he read them within a day or two of receipt, and then called me to discuss them. Beyond impressive.
For that kindness, he was repaid with this:
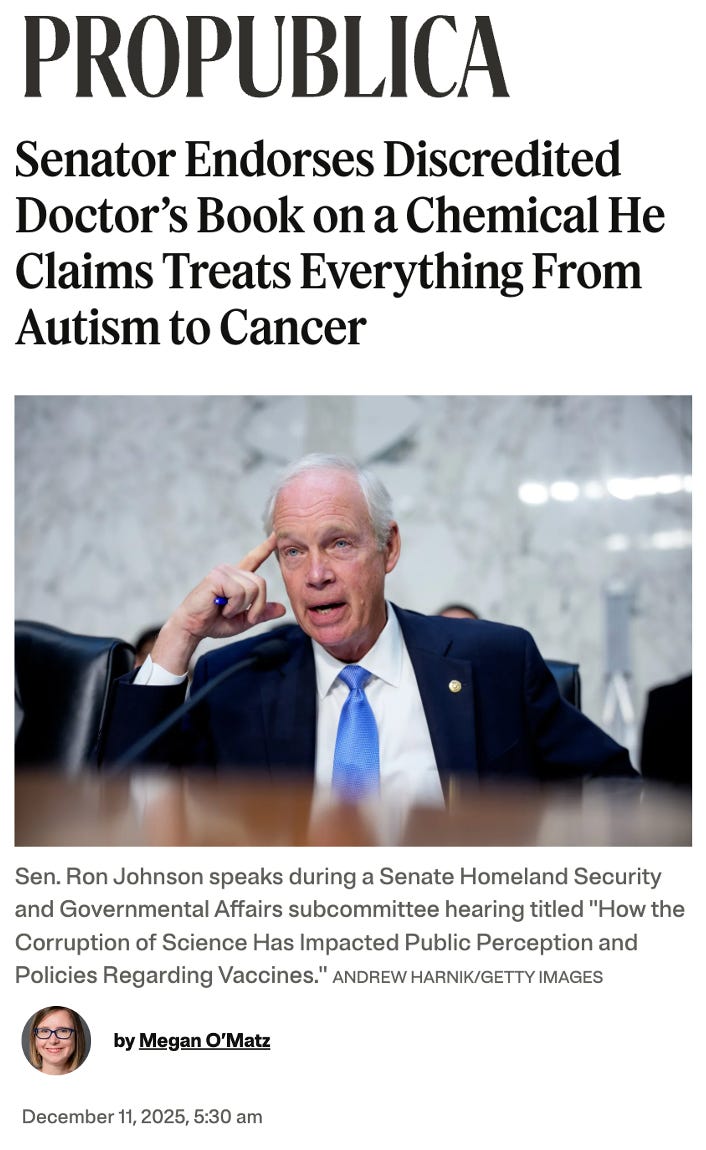
Of course, Ron didn’t “claim” anything, but don’t let the truth get in the way, Ms. Megan O’Matz. My co-writer then wrote two hilarious Substack posts on the ordeal: the first titled “Pre-Written Narratives and Premature Outrage: ProPublica’s Plan to Review Our Upcoming Book,” and the follow-up, “ProPublica’s Chlorine Dioxide Panic, Explained.”
That ordeal was kinda fun—for us, anyway. Probably less so for Ron.
And if you haven’t yet subscribed to Jenna’s Side (get it?), remedy that. She writes the funniest and hardest-hitting near-daily commentary on politics and current events anywhere. If you need a laugh in your day while being kept fully apprised of the folly of the world we live in, that’s the Substack to read.
Anyway, now, after two books devoted to suppressed medical therapies, I cannot adequately describe how strange, liberating, and genuinely joyful it feels to release three books about minerals and water and to expect that, this time, the argument will be about the ideas and the evidence rather than whether the books should be allowed to exist. I am enormously proud of these books, thrilled that they are finally entering the world, and frankly, delighted by the prospect that people might actually be permitted to discover and discuss them without first passing through the usual machinery of censorship, suppression, and reputational attack.
Most importantly for today’s post, know that, right near the end, as the final book was being readied for the printer, some data came to me that transformed its penultimate chapter.
First, let me tell you about the books. Then I will share that chapter with you.
The Stone and Water Series
The Stone and Water Series explores the hidden architecture that sustains life on Earth: the exchange between stone, water, and minerals that living systems have depended on since they began. It follows that architecture across geology, hydrology, soil science, origin-of-life research, agriculture, medicine, and history. It began with a single volcanic mineral extract and widened to the long scientific history of stone and water, the oldest questions about how life began, and ultimately, to the planet’s most urgent crisis.
A note on timing for the books below. Amazon will have a copy to you in roughly two weeks. Ordering directly from me arrives in three weeks, but every copy I sell is signed and stamped with my hanko, the Japanese personal seal I had carved after Professor Satoshi Ōmura prompted me.
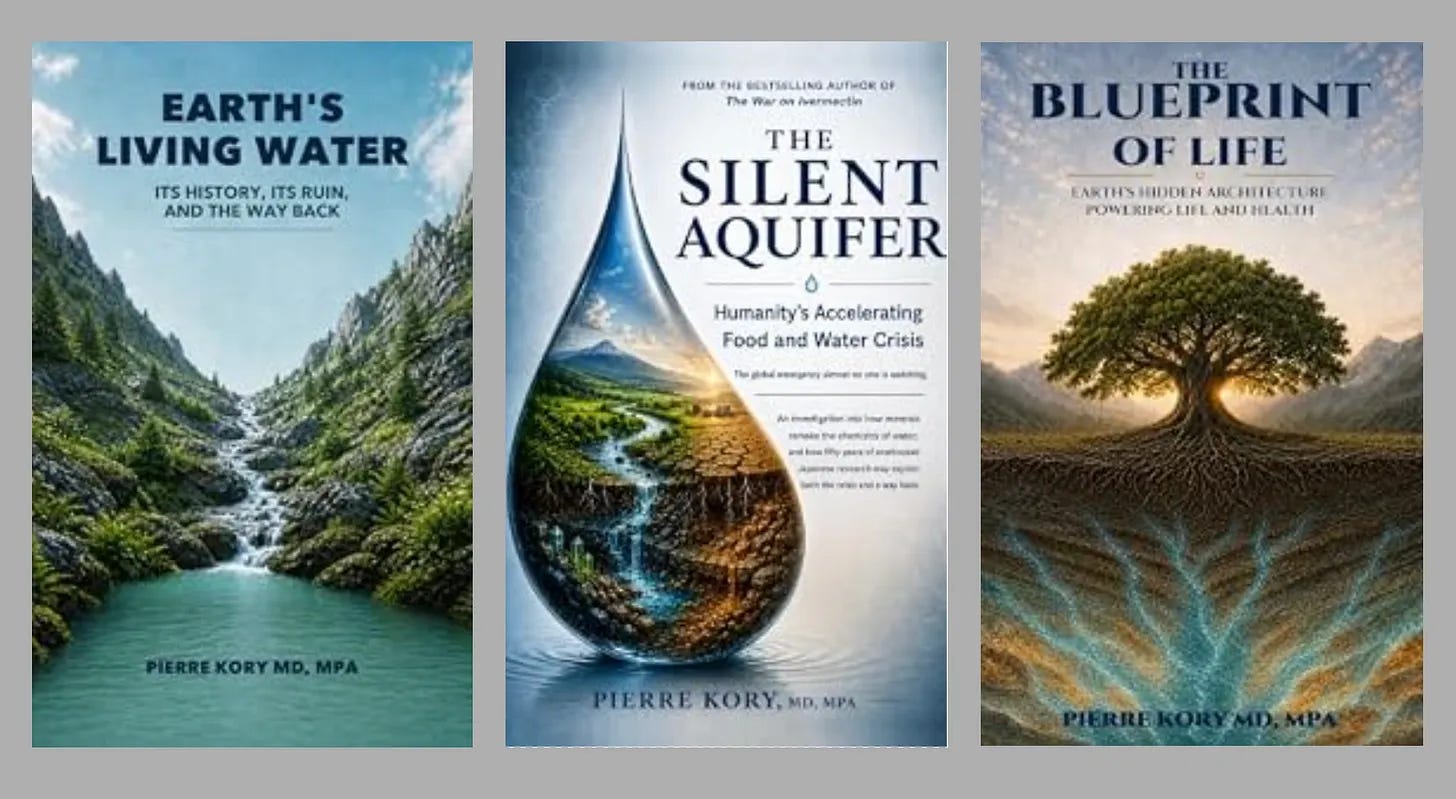
Earth’s Living Water: Its History, Its Ruin, and the Way Back is the complete investigation and authoritative reference text, over 700 pages comprising 70 chapters, over 200,000 words, and including over 650 citations (i.e., an encyclopedia). It traces the mineral-charged water beneath the living world through its whole arc: how that water was understood across centuries, how modern science came to overlook it, how a hundred years of agriculture, industry, and modern water treatment practices have degraded it, and how it might be restored. Fully documented and broad in scope, it is the definitive work at the foundation of the series. Available on my website or from Amazon.
The Silent Aquifer: Humanity’s Accelerating Food and Water Crisis is about the global emergency that I stumbled across during the research and writing of Earth’s Living Water, but presented at its sharpest. Focused, fast, and evidence-driven, it uncovers a synchronized planetary change in the chemistry of the water beneath the world’s farmland, beginning around the turn of the century, a change I named The Geohydrological Shift. Beginning with the Green Revolution and compounded by the world's industrial activity, this shift is quietly moving civilization toward being unable to feed and water itself, while the world’s alarm stays fixed on carbon and climate. It is a warning in the tradition of the great environmental reckonings, and, unlike most of them, it carries a practical, evidence-based map of the way back. For readers of Silent Spring, Cadillac Desert, and Dirt. Available on my website or from Amazon.
The Blueprint of Life: Earth’s Hidden Architecture Powering Life and Health looks downward, at what that same foundation reveals about life itself. It moves through origin-of-life research and the symbolic language of ancient texts, sets out the Rock-Water Circuit Theory and what I believe is the first internally consistent cosmological interpretation of the Emerald Tablet. It then asks whether nature's ordering architecture is better explained by accident, necessity, or design. Part scientific investigation, part history of science and theology, and part memoir, it traces one physician’s path from intensive care and the controversies of COVID-19 to a reexamination of order, creation, and God. Available on my website or from Amazon.
The first book spans the history, science, and the modern state of the relationship between minerals, water, and life on Earth. The second focuses on diagnosing and treating a crisis that almost no one is watching. The third explores why life is possible at all. Together they follow the same hidden system, from the first spark of life in ancient water to the aquifer failing beneath the world’s agriculture fields.
These books do not ask you to choose between science and faith, ancient wisdom and modern knowledge, or observation and meaning. They ask only that you follow the evidence wherever it leads.
And the ketamine book — The Quiet Revolution in Neurology and Psychiatry: How Daily Low-Dose Ketamine Can Cure Diseases Medicine Never Has — is the one sitting in the drawer and the one still growing out of our Leading Edge Clinic experiences. It is coming. When it does, you will be the first to know. But I gotta take a break first, or my wife and newborn baby son Lazlo will never forgive me (photos of baby Lazlo at end of post :).
I now present the penultimate chapter of The Silent Aquifer. Reluctant as I am to invite comparison with Rachel Carson and her landmark Silent Spring, I raise it only to mark a difference. Where Carson sounded an alarm, The Silent Aquifer tries to go a step further — detailing this century's equally quiet crisis while offering what I believe is a distinct, viable path toward a solution, or at minimum, a deferral of its worst consequences.
* Excerpted from The Silent Aquifer:
Chapter 11 — The Arithmetic of 2050, 2040, and Now
How did you go bankrupt? Two ways. Gradually and then suddenly. —Ernest Hemingway
Climate change arrived with a single galvanizing number, a single villain, and a global calendar of summits and reports to keep it in the news. I have my own doubts about how settled or scientifically accurate that story is, but they are not this book’s business, so I will set them aside. My concern is separate from that issue, and far more urgent. Climate has become the perspective through which the whole world now reads every environmental problem, and as a result, the crisis in this book has gone almost unmentioned, not because it is small, but because it is not, at its root, a climate problem at all. The most pressing threat to the world’s food and water is being buried inside a story that barely explains it.
A Word I Had Never Heard
The epigraph at the head of this chapter, Hemingway’s two ways of going bankrupt, gradually and then suddenly, I chose months before I understood how literal it would prove. I meant it as a figure for tempo: the way a slow loss hides itself until the instant it can no longer be hidden. I did not yet know that the people who study this most closely had seized on the same word and meant it without metaphor at all.
I found that out within days of sending this book to the printer. My collaborator Matt Bakos, scanning a feed he follows, caught a thread he didn’t recognize, clicked it, and opened onto a stack of recent releases I had somehow never seen, from the FAO and the United Nations, carrying a phrase I had not encountered once in eleven months of writing about this exact subject: water bankruptcy.540 541 Not a columnist’s metaphor but a formal term, newly defined in a scientific paper and taken up in a UN report because the old words—stress, scarcity, crisis—had stopped being big enough for what the numbers were doing.414
When the people who watch a system most closely have to borrow the language of insolvency to name it, the system is not just in trouble. It has failed.
I read those releases in something close to disbelief, not only at what they said, but because what they said was the most alarming data I had seen; the aquifers and the salt and the sinking ground all worse and faster than the figures I’d been working from. What stopped me was that I had come within days of printing a book on this subject without knowing the term for it existed. I hear “climate change” or “global warming” most mornings, in headlines I never go looking for. “Water bankruptcy” had to be handed to me by a colleague, by accident, at the eleventh hour. It is the argument of this chapter, proved at my own expense: a crisis so quiet it nearly slipped past the person writing the book about it.
The chapter title still carries the mark of that reckoning. For the months I spent on it, I called these pages simply “The Arithmetic of 2050.” The newest figures made that date sound like optimism; the failures I had filed under midcentury were already arriving, and some, like the crest of the Ogallala aquifer, were already behind us. So the chapter title changed to the current one. The arithmetic never agreed to wait for 2050; it had already become the arithmetic of now. The epigraph, though, I kept exactly as I chose it, because I could not improve it further. But I had invoked bankruptcy as an image while the field, as it turns out, had settled on it as a fact.
Before asking why this happened, it is worth considering a simple measure of public attention. Altmetric scores measure the attention a scientific paper receives across news media, government reports, policy documents, blogs, and social media, rather than simply counting academic citations. Nine months after it was issued, the FAO water report has barely made a sound.
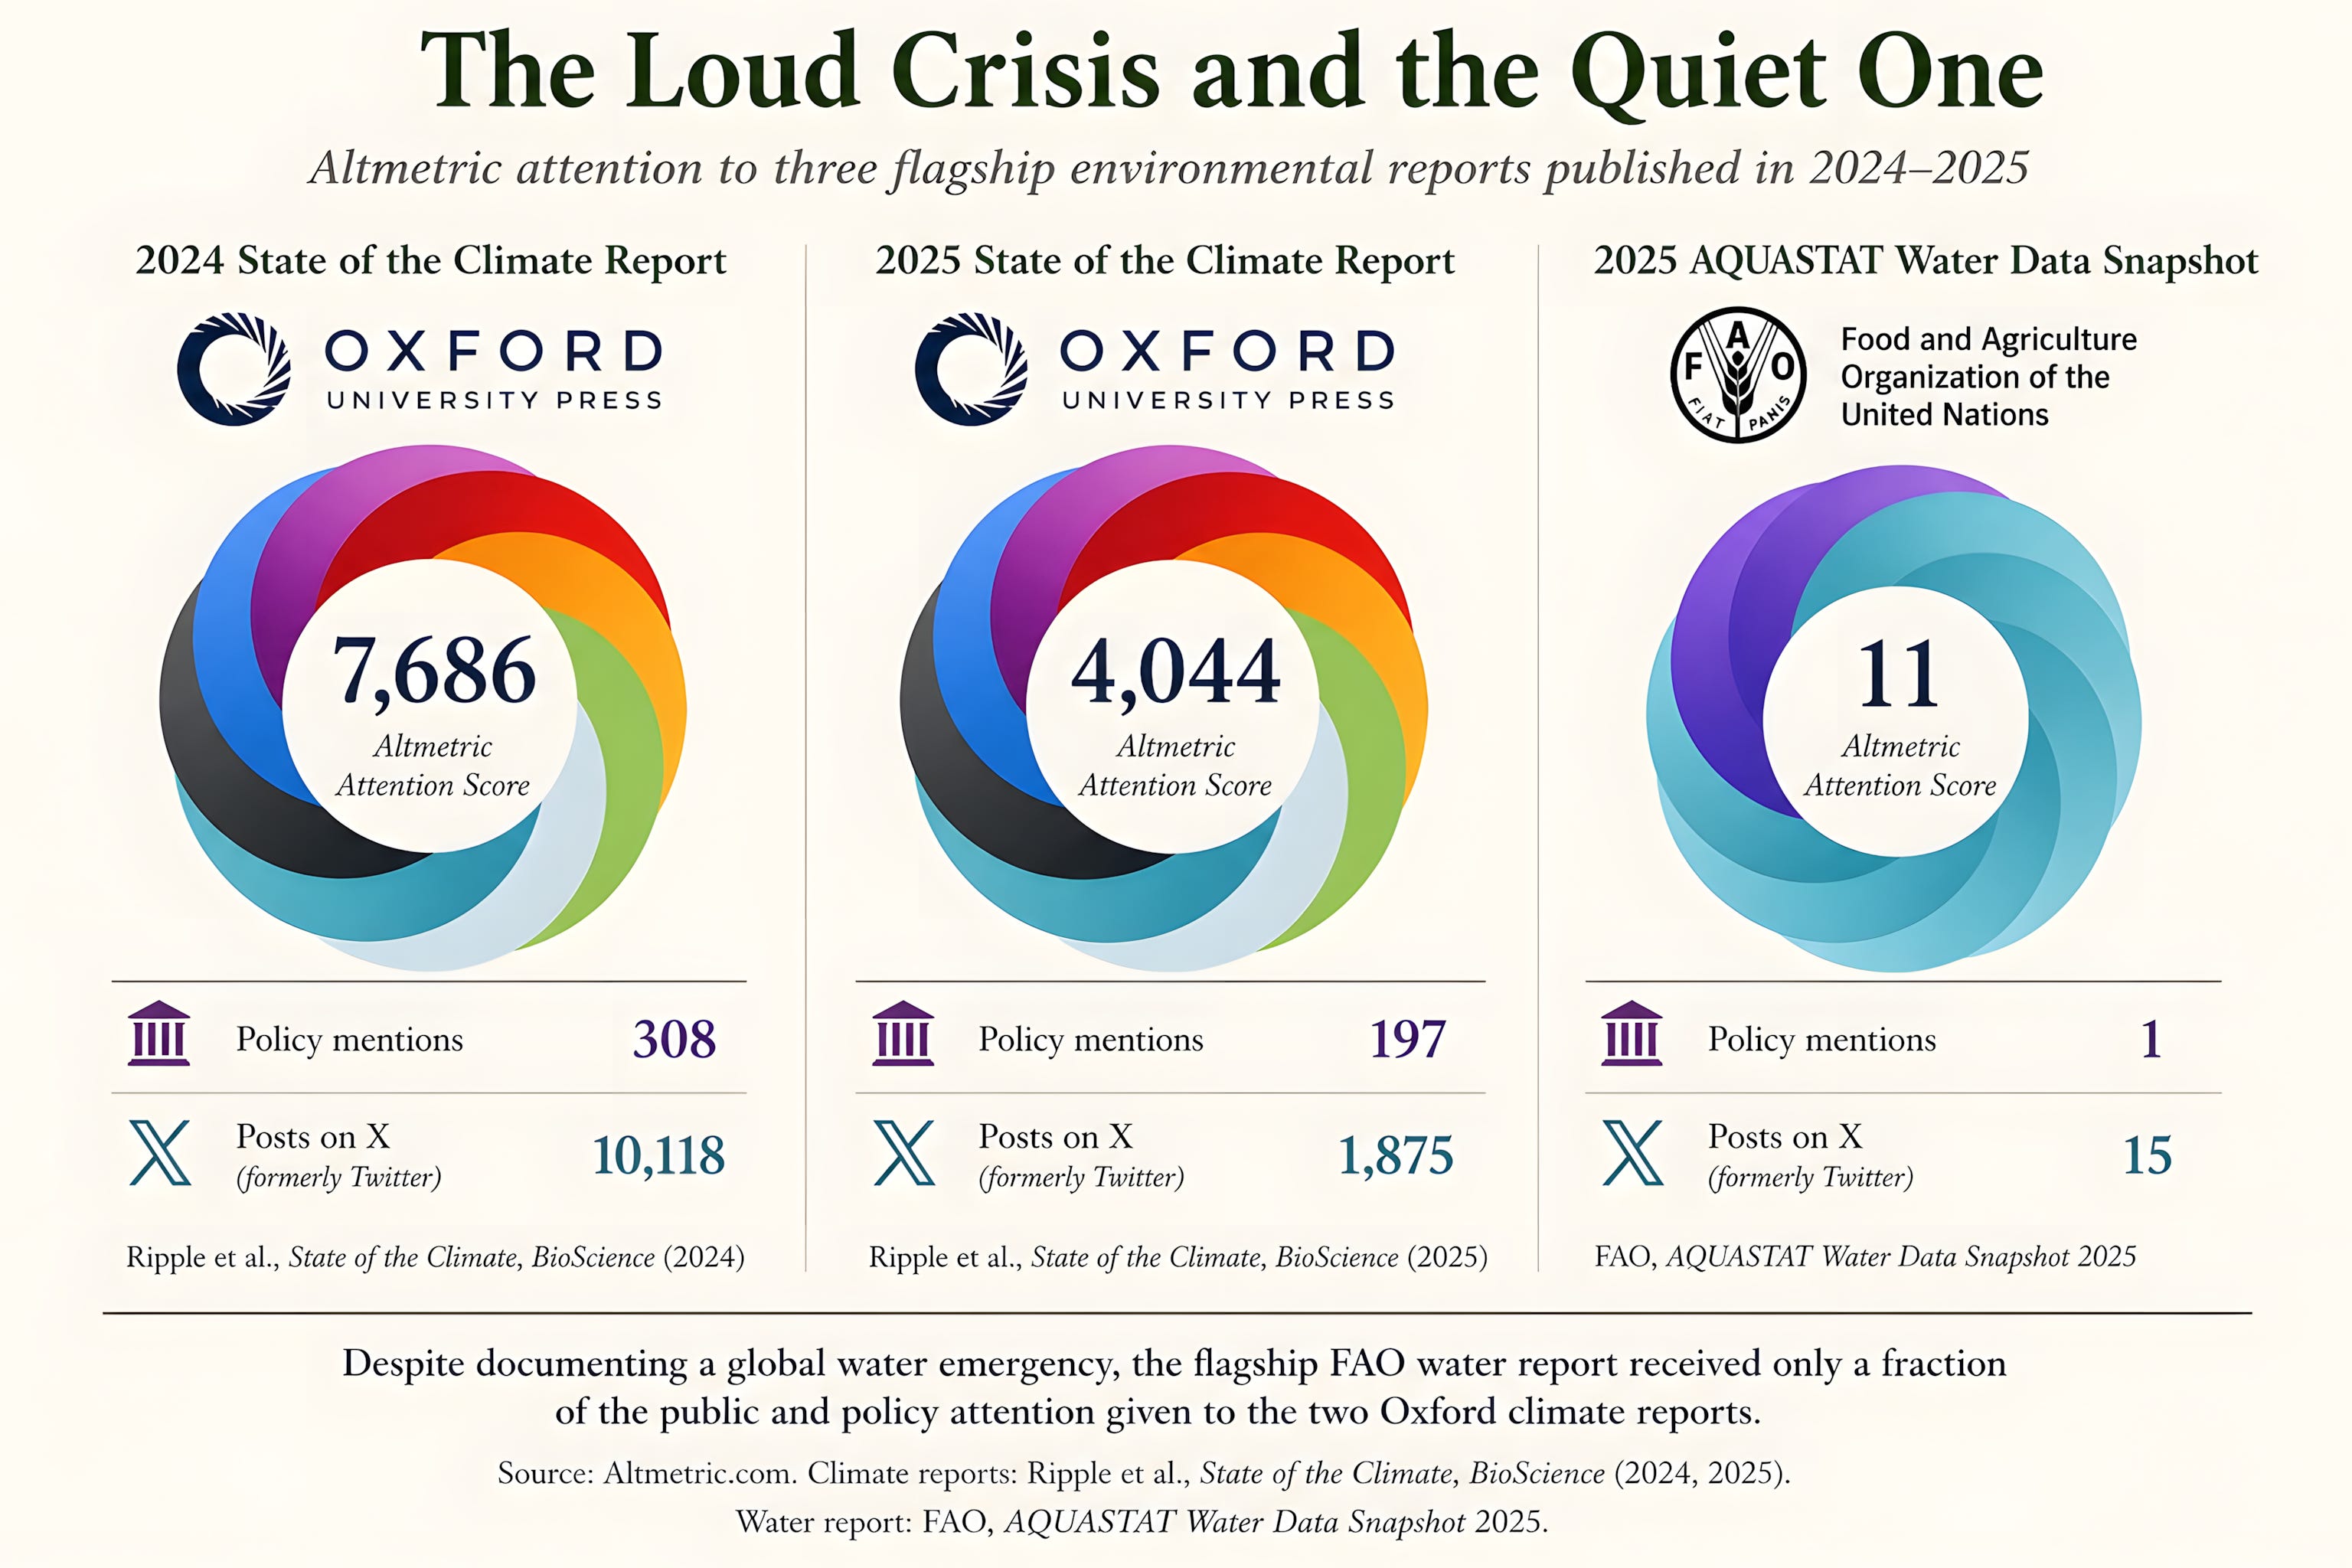
Figure 46.1. The near absence of public attention to the world’s rapidly developing water bankruptcy.
A Number I Once Sat On Top Of
I have measured that gap in attention from the inside. Altmetric is not a measure of whether a paper is right. It measures how many people are looking.
In 2021, I was the lead author of a review on the evidence for ivermectin in COVID-19, and my paper reached an Altmetric score of 6,300 within weeks, close to what the 2024 Climate Report is at now. But it kept climbing. Its final score is 15,356, placing it sixty-sixth among the almost 28 million research outputs that Altmetric has ever tracked—one of the hundred most-discussed pieces of research, in any field, in the service’s history.
I watched my number climb in real time, and then I watched what happened to the paper beneath it. It was recast from urgent to dangerous; the journal appended an expression of concern after a barrage of pharma-shill critiques were sent to me by the editor, which I refused to devote the immense amount of fruitless time it would have required to respond to. This led to the work being buried under an organized campaign of disinformation that I documented at length in The War on Ivermectin. I am not relitigating any of that here. I raise it for one reason. I have stood at the very top of this scale, and I know exactly what it registers. It registers attention. Nothing else.
Which is what makes the other end of the scale worth looking at.
On the seventeenth of December, 2025, the FAO released its most recent, and the most devastating, global water report in history.414 It generated five posts on X. Over the following month, that number rose to fifteen, and then stopped. Since its release, not one independent news outlet has covered it. Only one policy document has relied on it, and that was published by the FAO itself. Only five papers have cited it; one of which was focused on optimizing irrigation for cherry tomatoes. I guess this book will be the 6th.
A single review of a repurposed generic drug drew almost 600 times more attention in its first fortnight than the world’s food and water supply crisis has drawn in almost a year.
News Cycles and the Climate Frame
One reason the coming crisis remains quiet is that it lacks the elements a story needs to command attention in modern news cycles. Climate change, by contrast, has all of them. It offers not one alarming number but several: carbon in the air, the rising sea, and above all the temperature, which television has learned to render as spectacle, with the map of the country washed in deepening reds, the hurricane wheeling across the ocean as a vast white spiral, the same furious palette returning night after night because it works. It has a villain, a variety of metrics and images, and, most of all, fear.
And much of the coverage the food and water crisis does get is filed under climate—“climate-driven drought,” “climate threats to harvests”—so that the story survives but loses its own identity. That does the reader a real disservice, because much of this crisis is not climate-driven at all. Aquifer depletion is fundamentally an extraction-rate problem: we are pumping groundwater faster than it can be replenished, and that would be true even on a perfectly stable planet. Soil degradation, nutrient mismanagement, and irrigation policy would be problems with or without a changing climate. The water crisis and the climate crisis are entangled, but they are not the same crisis, and treating one as a subplot of the other has let the quieter one grow in the dark.
There is also the problem of speed. A hurricane makes landfall in an afternoon; a wildfire crowns a ridge in minutes; a heat record breaks in a single blistering week: each one perfectly fit for a news cycle. Meanwhile, an aquifer falling half a meter a year, or a soil losing its fertility over decades, might generate a serious news article once a year, and not always on the front page. Human attention, and the media built to hold it, is tuned to events, not to gradual baselines, and a catastrophe with no single dramatic moment is chronically under-covered, for the same reason topsoil loss and antibiotic resistance are. A crisis can be enormous and still move slowly enough that most people do not pay attention to it.
The clearest proof is the industry the whole world is currently watching. Artificial intelligence is scrutinized more closely than almost any technology in history, and when people worry about what it consumes, they worry mostly about electricity—the power-hungry data center, the strained grid, the plants firing back up to feed it. It is also among the thirstiest industries ever built, planting much of that thirst directly over aquifers that are already failing, as the last chapter described; and that half of the story arrives, when it arrives at all, as the subordinate clause.
If the water can be sorted into silence there, with the facts in plain view, it can be sorted into silence anywhere. And it has been, quietly, beneath the world’s food for twenty-five years. I know that silence from the inside—it is the one that nearly swallowed this book, the one I opened this chapter with.
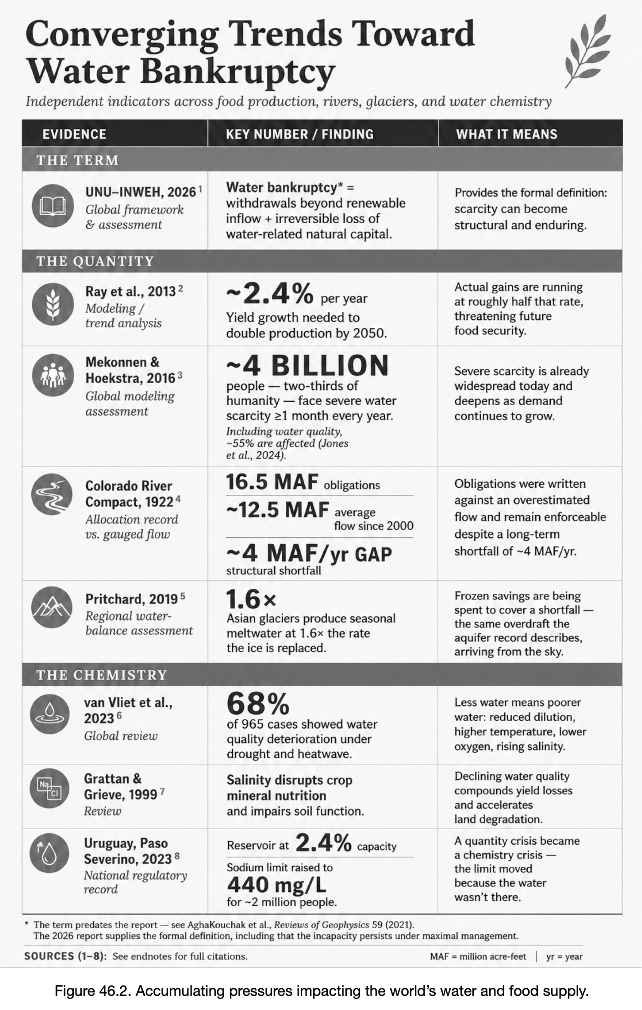
Before diving into the individual numbers, it is worth stepping back and looking at the larger picture. The studies listed in the figure on the next page come from different disciplines and different institutions, yet they point in the same direction. Crop yields are slowing, water demand is rising, freshwater resources are under increasing strain, water quality is deteriorating, and even the international organizations tracking these trends have concluded that the traditional language of “scarcity” no longer captures what is unfolding. Read separately, each study is concerning. Read together, they describe a single converging crisis.
(Note for the figure: MAF= million acre-feet)
The Food Gap
Let’s start with food. Projections of the food required by 2050 vary sharply with the baseline, the unit being measured, and the assumptions built into the model. One influential trend analysis projected that global demand for crops could rise by 100 to 110 percent between 2005 and 2050 as population and income increased.501 The FAO’s 2012 analysis was more moderate, projecting that total agricultural production in 2050 would be about 60 percent above its 2005–2007 level.541 A later meta-analysis of fifty-seven global projections placed the likely increase in total food demand between 35 and 56 percent from 2010 to 2050,543 while the World Resources Institute’s widely quoted 56-percent figure refers specifically to the gap between crop calories produced in 2010 and those projected to be required in 2050.544 I have no quarrel with the lower numbers.
But let’s start with the highest number, since that’s easiest, and then move to the lower numbers. Doubling the food supply by 2050 would require yields to rise about 2.4 percent a year.500 That figure has a date on it. Scientists set it in 2013 and, in effect, fired a starting gun: from that year on, the world had to achieve 2.4 percent gains in yield each year to cross the line by 2050.
It has not.
Chapter 43 gave the rates measured when the starting gun was fired: 1.6, 1.0, 0.9, and 1.3 percent gains a year for maize, rice, wheat, and soybean. Every one falls short of the mark.500 Carried to 2050, they deliver something like 67, 42, 38, and 55 percent — not the 100 percent the doubling projections call for.
Now consider that the numbers above were from 2008. To understand where we are now, I went back to the raw United Nations yield figures they used and applied the same method to data from 2024, the most recent year on record, for the four crops that supply close to two-thirds of the calories humanity eats.
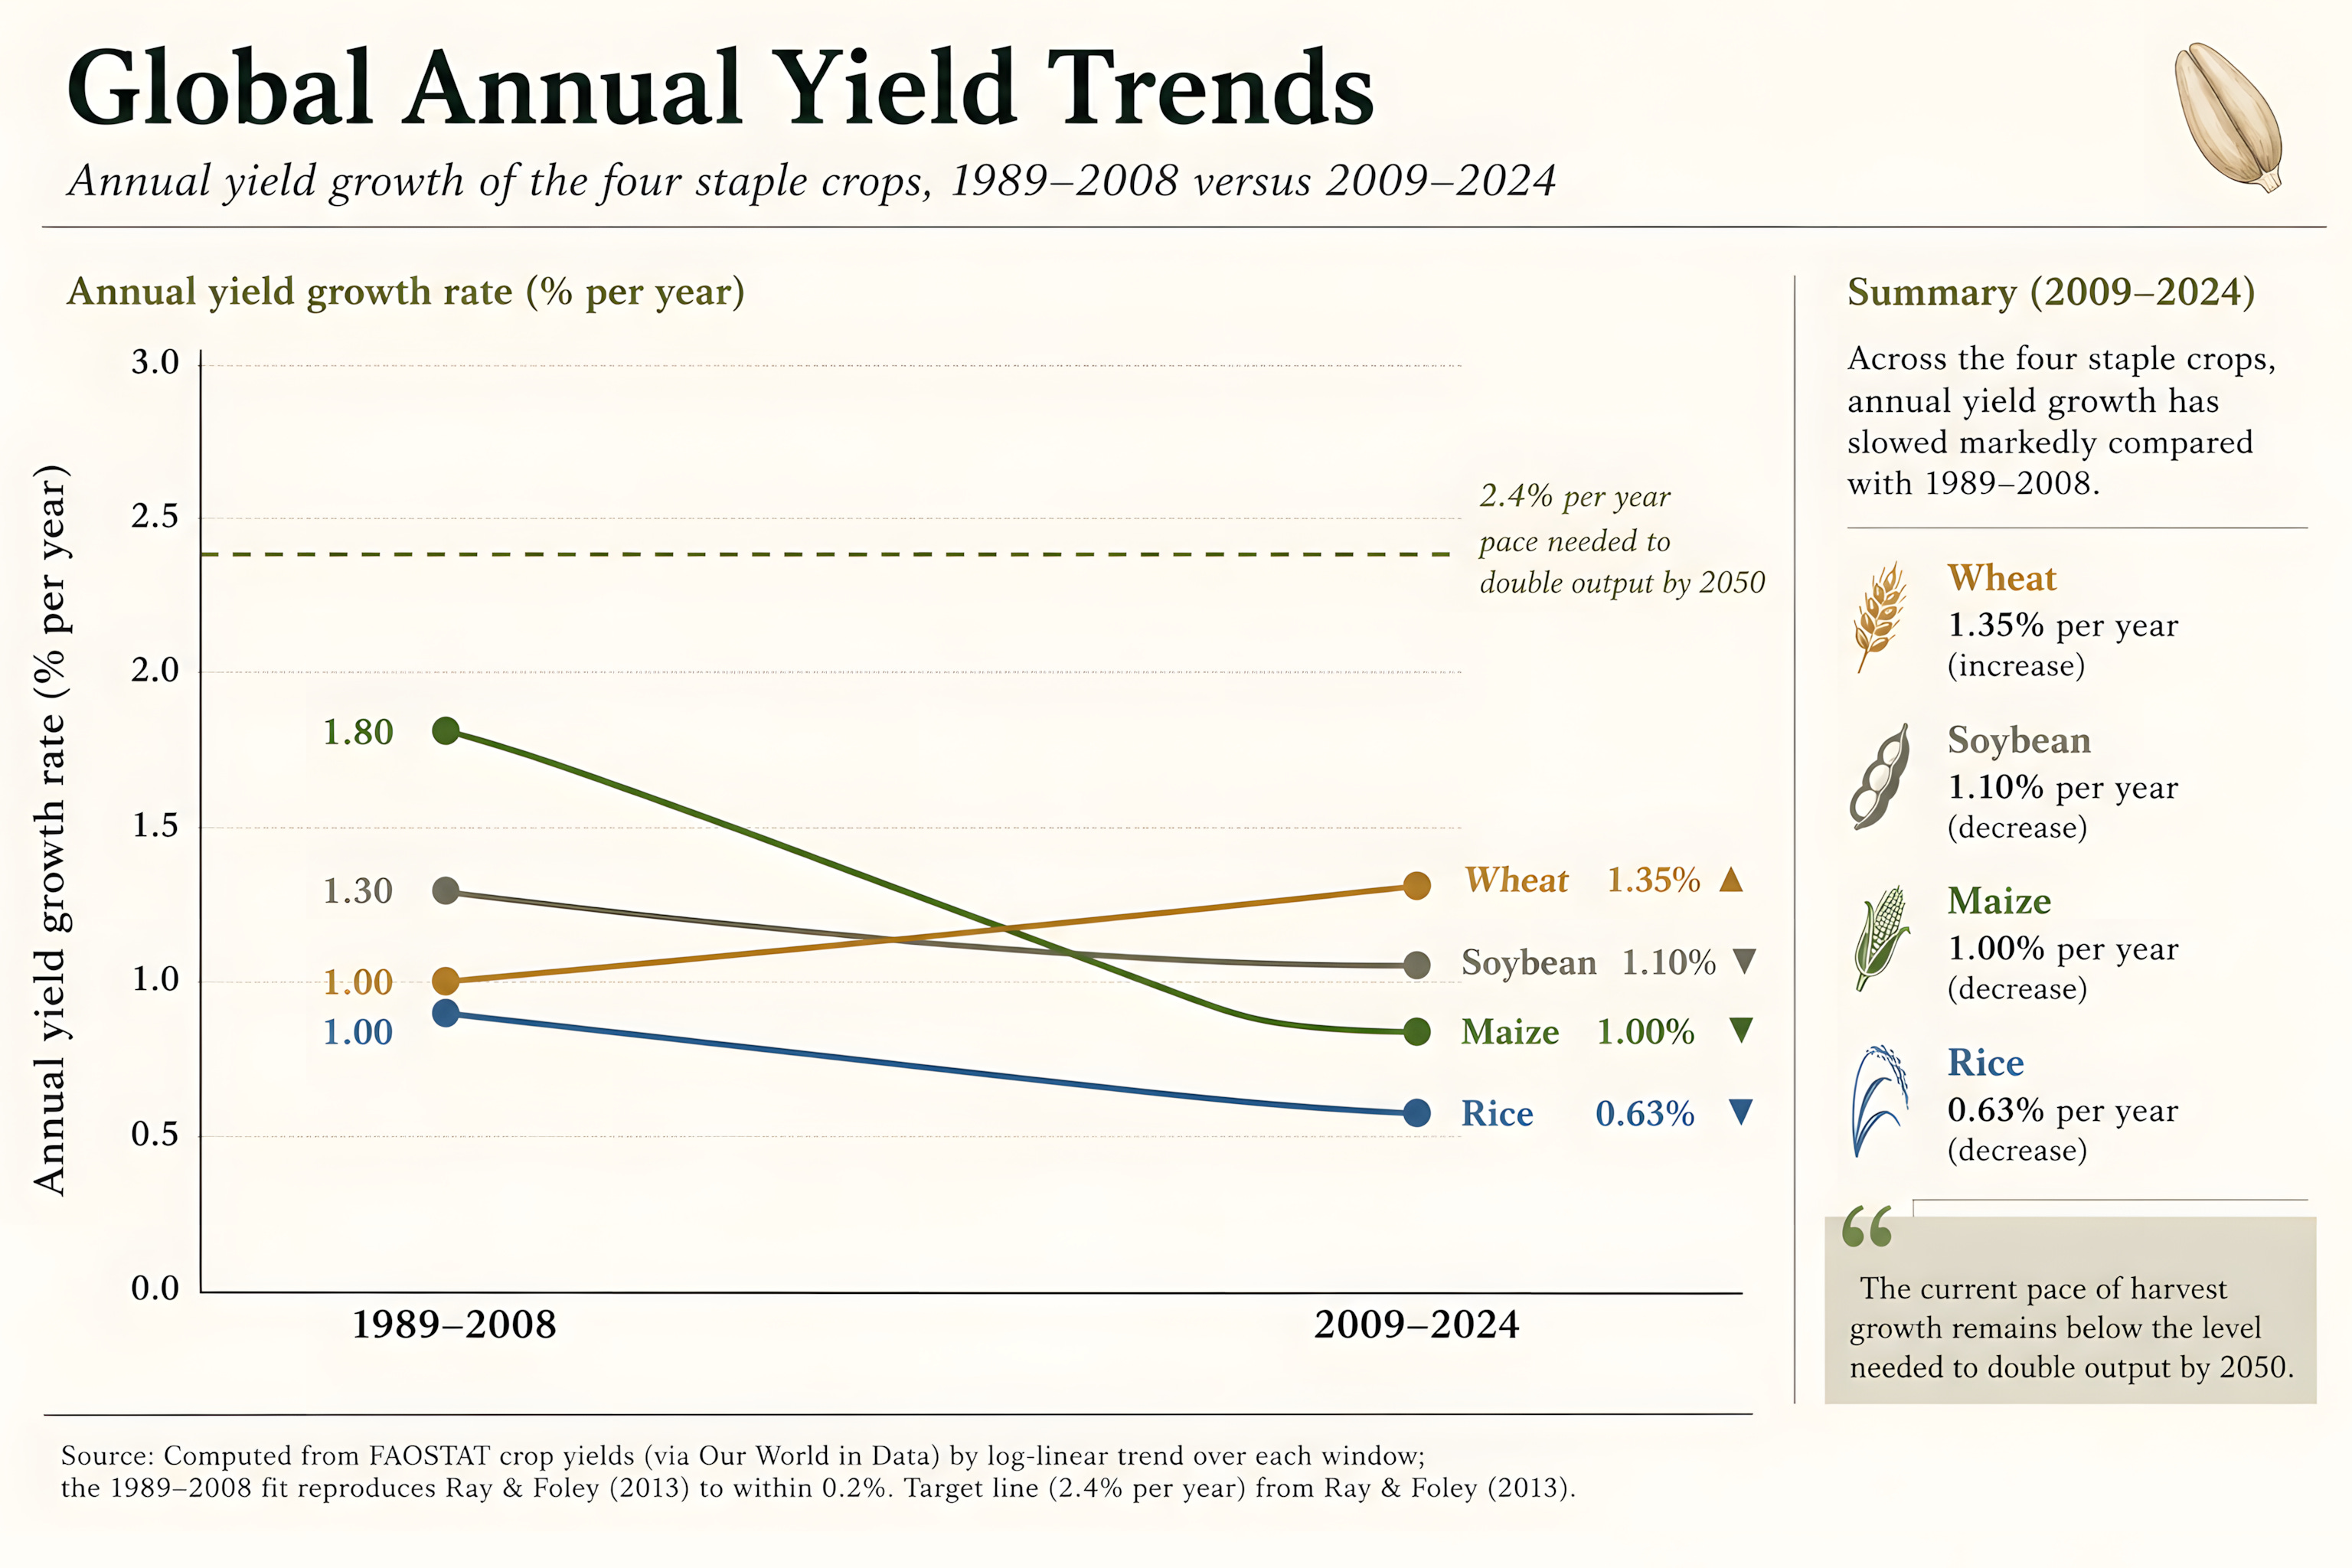
Figure 46.3. Method Footnote: 2024 updated world average yields for maize, rice, wheat, and soybean from FAOSTAT, as compiled by Our World in Data, fit to a log-linear trend over 1989–2008 and 2009–2024.
Now let’s set the demand at its lowest plausible level and ask whether current yield increases can meet it. Even the gentlest projections, the ones asking for barely half as much food, again, still need the major staples to keep gaining better than a percent a year, every year, without pause.
Yet, three of the four major crops have slowed. Maize dropped by more than 40 percent, from about a 1.8 percent annual rise to 1.0 percent. Soybeans slowed from 1.3 to 1.1. And rice, the grain that feeds more people directly than any other, fell by 37 percent from 1.0 percent a year to 0.63 percent, less than half of what even the most modest 2050 estimate requires. Only wheat has risen, from 1.0 to 1.35 percent. One staple out of four is gaining ground. The other three are giving it back.
Return to the starting gun. It fired in 2013, and thirteen years on, the pace has drifted the wrong way on three of the four staples. In a race against a deadline, falling short compounds: the gap widens with every season the runner fails to close it. Line the rates against the target, and the doubling is not within sight, and neither, on three of these crops, is even the most optimistic target.
The doubling narrative has been contested by researchers who argue that hunger reflects access, poverty, distribution, waste, and the diversion of crops to livestock and fuel as much as an absolute shortage of production.545 I agree that about a fifth of the food available to people is wasted, about a third of the world’s cereals are fed to animals, and a rising share is burned as fuel rather than eaten.546 547 But that argument rests on multiple failed assumptions. The first is that food waste will somehow be recovered, but no data support that. The share of food lost between harvest and market has not fallen since the world began tracking it in 2015; it has drifted upward.548 Meat demand is projected to keep climbing rather than level off, and the grain diverted to biofuels is rising rather than shrinking.547
Every argument the optimists make is moving the wrong way. And beneath all of them sits the biggest assumption of all: that food is a single global pool, so hunger is only a delivery problem. Grow the surplus where you can, ship it to where you cannot, and no one goes without. It sounds reasonable, which is why the coming shortfall is so easy not to be alarmed about.
Two facts shatter that argument. The first is that we already grow enough to feed everyone alive, yet hundreds of millions still go hungry because food does not reach the poor, the remote, or the politically inconvenient. If today’s abundance has not reached them, tomorrow’s smaller harvest will not either.
The second is the one this whole book has been building toward. Shipping surplus assumes there will always be a surplus somewhere to ship. But surplus exists only where the water still works, and the water is now failing in exactly those places, for the same reasons it failed everywhere else. The great breadbaskets are not exempt. The Ogallala beneath the American plains, the aquifers beneath the North China Plain and the Punjab: the chemistry has changed, and the volume is falling. The first is already in the yield numbers. The second is the hammer still coming down. The models miss this because they treat water, and the chemistry it carries, as a fixed backdrop that will keep doing its part. This book has spent its chapters showing it will not.
When Ray and his colleagues last mapped it, using 2008 data, yields had stopped improving across somewhere between 24 to 39 percent of the harvested area for the four great staples.497 Almost twenty years later, that map has never been redrawn. The most recent global study of the same ground, published in 2024, still runs on data ending in 2010, and it finds the pressure has only built: on roughly 84 percent of the world’s rice land and 56 percent of its wheat land, yields now sit close to their attainable ceiling, the narrowing zone from which Ray’s stalled cropland was drawn.549 No one has measured, with data from the years since, how much of that ceiling-bound land has already gone flat. But the direction is not in question. The rate at which rice yields have climbed has fallen by more than a third since that decade, on the crop with the least room left to grow.
The Number to Watch Is the Price
Everyone watches the hunger count, and by that count things are improving — three straight years of decline — with about 673 million people, roughly 8.2 percent of the world, still short of food in 2024.386 But the hunger count is the wrong number to watch. Hunger moves late, propped up by reserves opening, aid arriving, and families trading down to cheaper, thinner food, all of which can hold the official number flat while a household’s diet quietly gets worse. It is also a once-a-year survey published well after the fact.
The number that moves first is the price. The world grows food with little to spare, stocks are thin, and people have to eat whatever it costs, so when the world grows even slightly less than it needs, the shelves do not empty. Instead, prices rise sharply because a small shortfall pushes against demand that will not bend. Price is also what turns a shortage into hunger: the food does not vanish from the market; the poorest are simply priced off the shelf before they are ever counted as hungry. You can already see the two numbers starting to split apart. The cost of a healthy diet has climbed year after year since around 2000, and about 2.69 billion people, a third of humanity, now cannot afford one, even as the hunger count slips.386 The world’s flagship hunger report now turns on that very figure, a sign that the agencies built to count the hungry have begun to watch the price instead.
The “Canary in the Field” chapter showed that this has already happened: after decades of dropping prices, prices began rising around the turn of the century, in the same window as the dip in yield gains. I will admit that sharper jumps in prices come from shocks like wars, droughts, and spikes in oil prices that drive fertilizer and freight costs, but those pass. What does not pass is the slower rise beneath them, the plain cost of coaxing a ton of food from tired ground and degraded water. When each acre yields a little less, the farmer spends more to grow the same crop, and that cost lands in the price. A slow erosion of yields, the kind this book lays at the door of the water chemistry and the soil, would not arrive a mass famine. It would arrive first as food that costs a little more every year, and water chemistry is one of the forces lifting that price, the one variable no one is watching.
The Wells Still Draw
Before water-supply accounting begins, one fact about timing needs to be considered. The yield slowdown just laid out isn’t from the water running out. It has been occurring while the water is still here. Across most of the world’s irrigated cropland, the wells still draw, and the fields still drink, and the harvest is already slowing. If depletion were the only mechanism to decrease yields, the only slowdown would be ahead of us, on the day when the wells fail. That day has not yet come, but the slowdown has been going on for twenty-five years. The blow doing the damage now is not the quantity of water but the slow alteration of the water still present — its chemistry, not its absence.
The depletion analysis that follows describes a second blow, separate from the first. The first is already on the field. The second, when it arrives, will not land on a healthy system that can absorb it. It will land on a system already weakened by the quiet one.
The Water Gap
Now set the water next to the food, because they are connected. Irrigation for agriculture accounts for roughly 70 percent of global freshwater withdrawals. Yet rising food production does not translate into an equal rise in irrigation.443 In the FAO’s projections, agricultural output would grow about 60 percent between 2005 and 2050, while modeled irrigation withdrawals would rise only about 11 percent, from roughly 2,620 to 2,906 cubic kilometers a year.541 The gap assumes the added agricultural output would come from higher yields on land already in production, but the water figure credits irrigation with becoming more efficient than it is today.
But even that modest global rise would fall unevenly, placing the greatest demand on regions where water is already scarce and aquifers are already falling. In some of those regions, the future the projection warns of has already arrived.
The measure is straightforward: what a region withdraws each year, set against what its rain, rivers and aquifers can renew — minus what has to stay in place for those rivers to survive. Below 25 percent, the FAO calls a region unstressed. Above 75 percent, it is in high stress. Above 100 percent, it is no longer living on what returns each year; it is spending reserves that took millennia to fill.
By the FAO’s 2022 accounting, North Africa’s withdrawals had reached about 121 percent, drawing down ancient groundwater to cover the gap, while Southern Asia stood near 77 percent and Central Asia near 70 percent.542 The 2050 demand curve is not a forecast in those places. It is the meter reading.
An American reader may be tempted to file those numbers under other people’s problems. The national accounting invites it: the United States as a whole sits comfortably inside the FAO’s unstressed band.
That average is one of the most misleading numbers in this book. A country does not eat its average. It eats what grows in particular places, watered by particular aquifers, and those keep their own meters. The Ogallala is indifferent to how much rain falls on Michigan.
When researchers modeled the year each High Plains state would drain its groundwater fastest — peak depletion, the last year of maximum water — the dates were not ahead of us. Texas crested in 1999. New Mexico in 2002. Kansas in 2010. Oklahoma in 2012. Colorado in 2023.
** Part of the mission of The Silent Aquifer — and part, only part of Medical Musings going forward — is to help the scientists behind that devastating FAO report, along with the many researchers whose work they drew on, actually get their message heard. Because according to Altmetric, no one — and I mean no one — is listening. Please help support that effort:
Day Zero Events
The deadlines in this chapter generally, and arbitrarily, focus on 2050, largely because several influential papers in the field used that target for projections starting twenty years ago. But several cities have already arrived there.
The phrase is Day Zero—the day a city stops delivering water to people’s homes, and people are then forced to fetch it. Cape Town created the term in 2018, and what is usually misunderstood is that Day Zero is not actually a date. It is a water supply threshold: when thirteen and a half percent of combined dam storage remains, it would force the city to shut the reticulation and send four million people to roughly two hundred collection points. The projected threshold was avoided from April to June, and was finally suspended in late June. But the city got there only by cutting consumption close to sixty percent, from something over eleven hundred million liters a day to about five hundred.
Others have followed. Chennai’s four reservoirs were down to eighteen million cubic feet at the end of June 2019, in basins built to hold more than eleven billion — a sixth of one percent.551b São Paulo literally went beneath the bottom. The pipes that draw from the Cantareira reservoirs sit well above the reservoir floor; thus, the water below them had never been counted as part of the city’s supply, because there was no way to get it out. In 2014, the utility installed pumps and took it — twice.551c Through that year and the next, households across the city found the taps weak or dry at night while the state maintained that no rationing was underway.
But the more important thing about Day Zero is how a city avoids it. Cape Town’s dams are above seventy-five percent again. That is not the same as the city having recovered.
The city asked its residents to conserve, and they did — close to sixty percent. Selling less water collapsed the utility’s revenue, and the city made that revenue back from the people who had the least of it. Universal free basic water, the allocation that exists so that being poor does not mean being thirsty, was withdrawn. The lowest tariff bracket rose six hundred percent in a single month.551 Devices that throttle a household’s flow to a trickle once its quota is spent were installed by the thousands, and sixty-four percent of them went into poor communities.552 The wealthiest tenth of the city was using roughly half of Cape Town’s water throughout, and absorbed almost none of the enforcement.553 Shocker.
The city was saved by the households that used the least, and the bill was sent to them.
What ended in Cape Town was the deadline. The rationing became permanent, moved off the front page, and was redistributed onto the people least able to argue with it.
I searched the scientific literature for an inventory of Day Zero events and found only one: the same 2023 paper cited above, whose caption concedes that its cities were assembled “as reported from several media outlets” and whose sources for that figure are the BBC, Reuters, and the Guardian.553 The one count in circulation—more than eighty cities—comes from a study measuring something else entirely. So the category exists at the discretion of coverage.
Two researchers who studied the Cape Town campaign concluded that Day Zero was “a purposefully designed narrative in political communication,” and that its “unfeasibly precise prediction of water ‘running out’… obscured scientific uncertainties.”
Worse, Cape Town, which named the term and is the only city people think of when hearing it, never actually reached Day Zero because storage bottomed at 21.2 percent against a 13.5 percent threshold, the date moved four times, and the reticulation was never shut.
Then I discovered that Bogotá cut its taps on a rotating schedule for three hundred and sixty-six days, Curitiba for six hundred and forty-nine, and Monterrey’s main reservoir ran dry, yet none of the three appears on anyone’s list, because no list exists. The event is defined by whether a camera arrived.
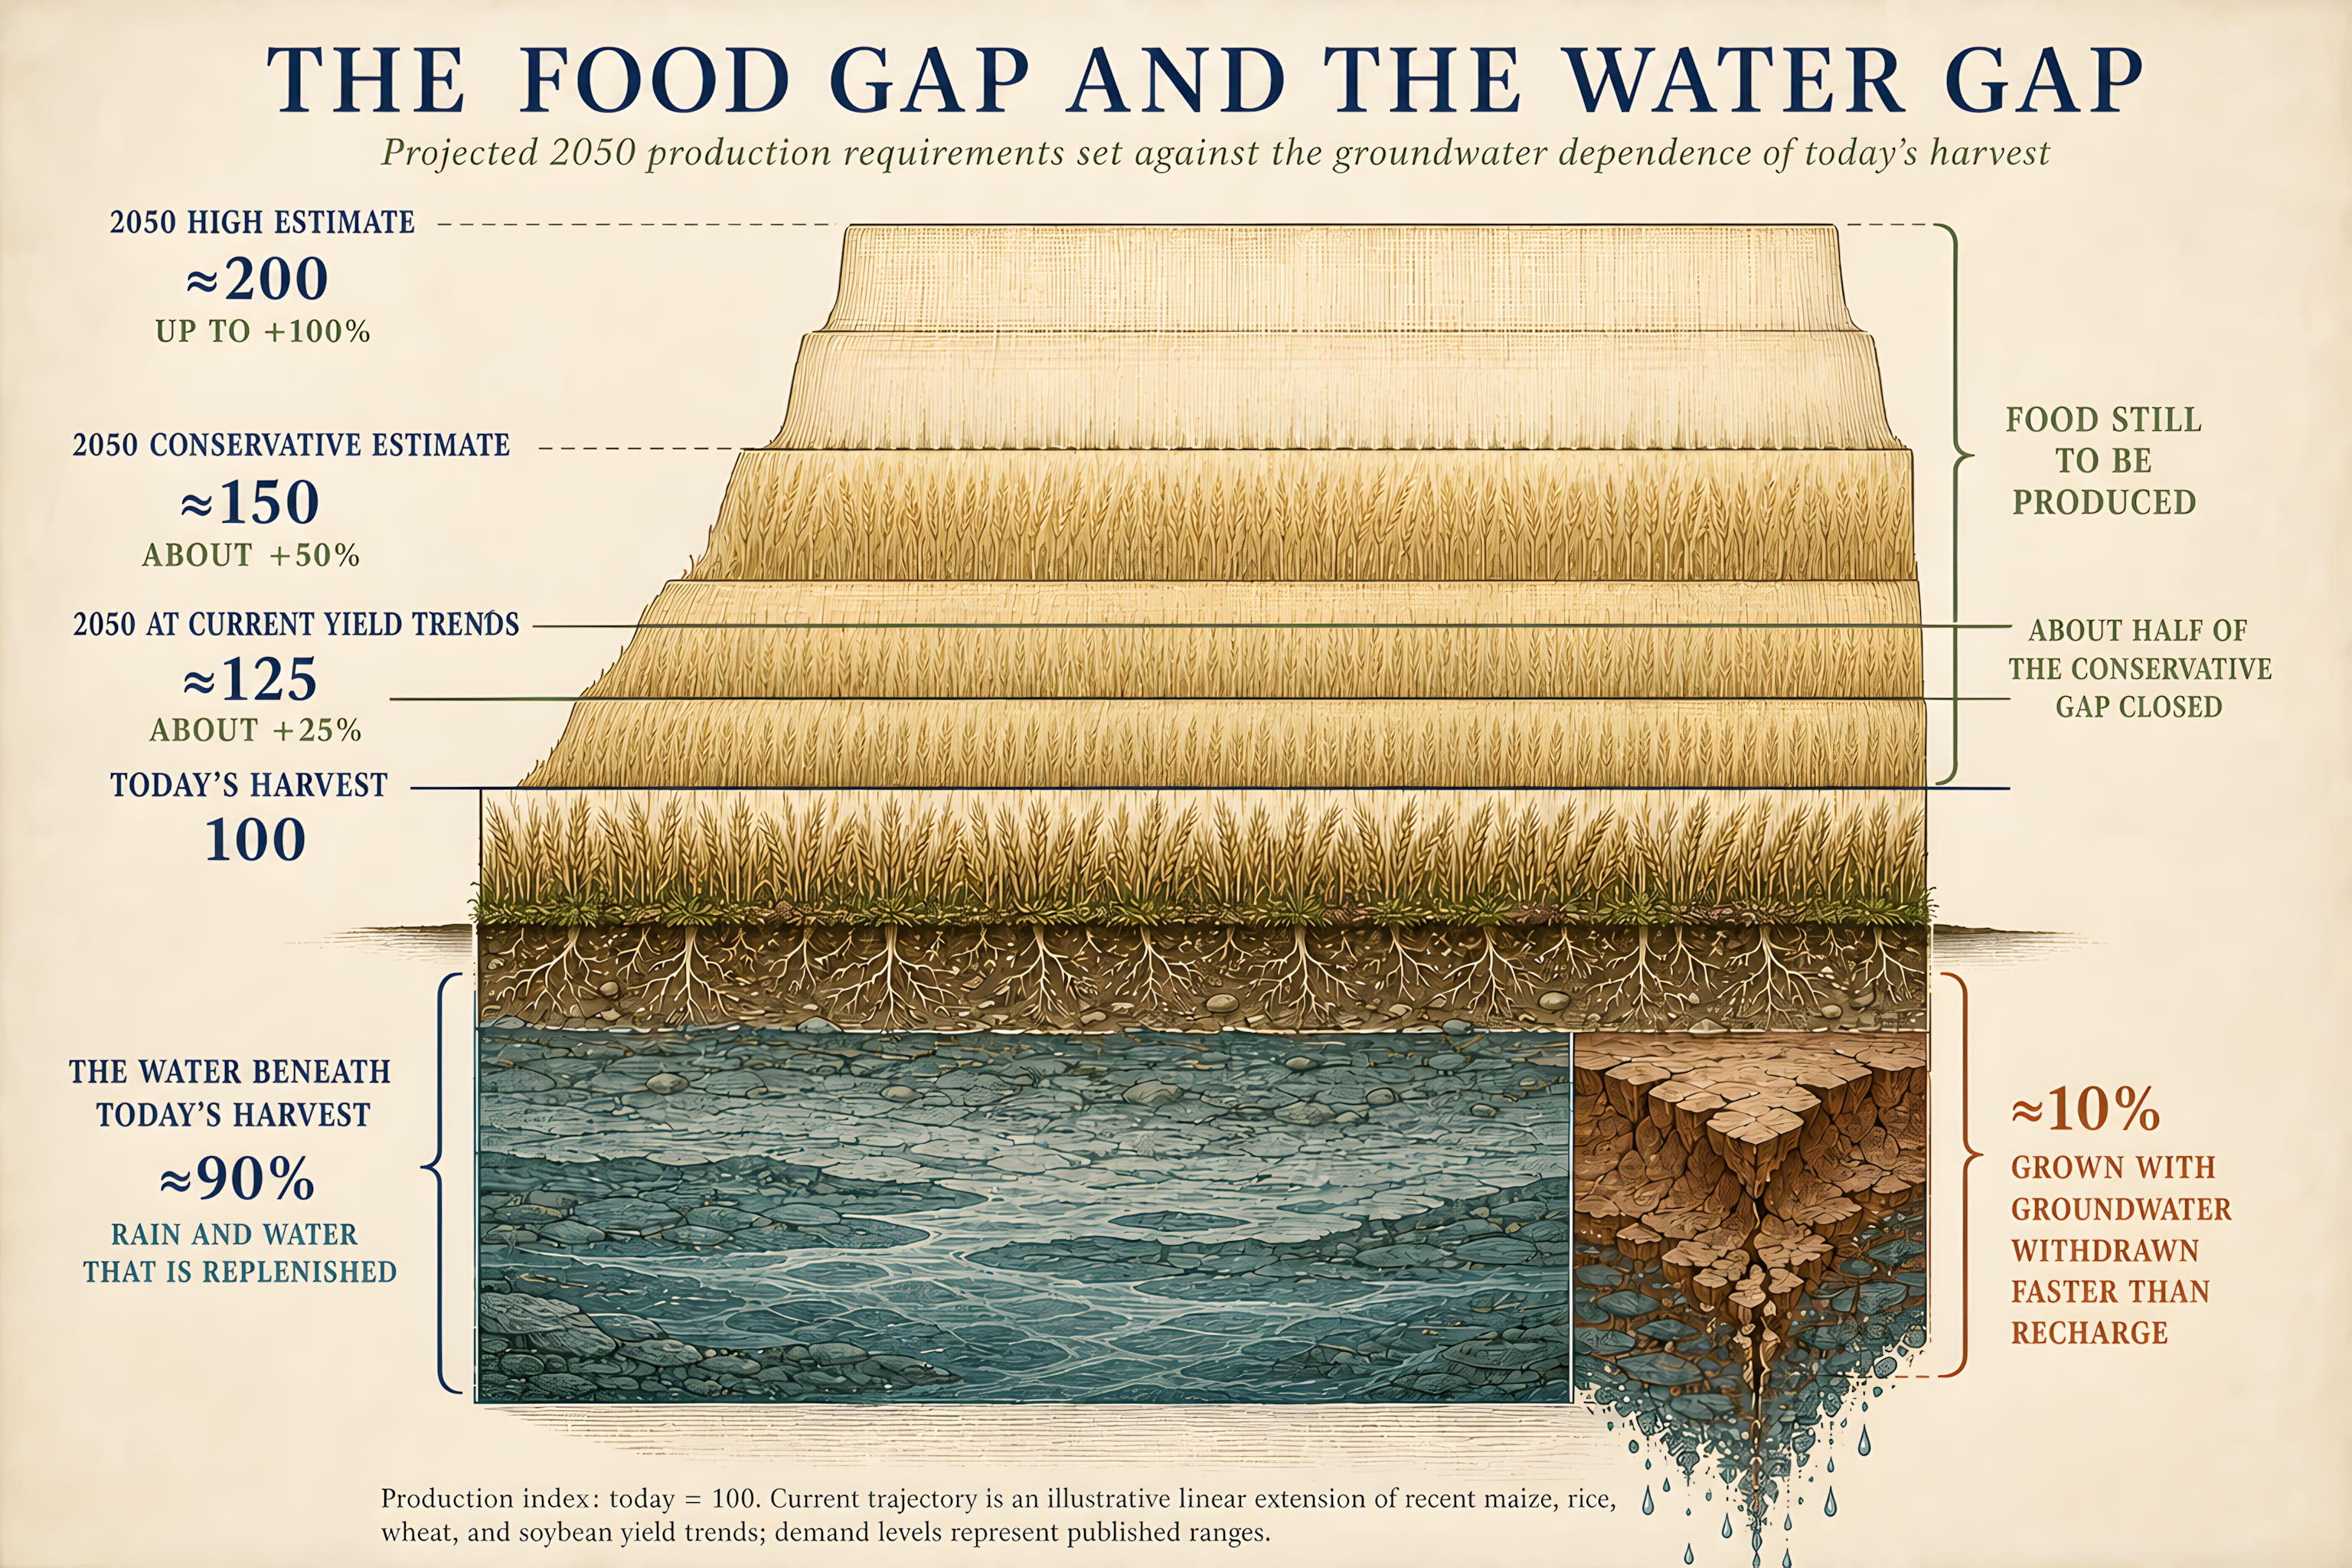
Figure 46.4. Global food demand projections for 2050 compared with our current trajectory and groundwater dependence.
Looking at either trend by itself reveals a serious problem. Look at them together, and they are something worse, because they are not independent; they multiply. We must grow far more food, on yields climbing too slowly or not at all, using more water, at the exact moment the water is degrading and running short. As the previous chapter detailing the Geohydrological Shift showed, we will also have to do so with different, more hostile water chemistry. The food crisis and the water crisis are not two problems. This book argues they are two consequences of one disturbance: the quality of the water beneath the food.
Aquifer Depletion Dates by Region
Numbers like these stay abstract until they have a place and a date attached. Here are a few, and they are not far off. One thing to keep in mind as you read them: an aquifer almost never runs to literal zero. A region’s wells fail when the water becomes too deep, too costly, or too salty to lift economically; so the crisis arrives not as a sudden empty tap but as abandoned fields and hollowed-out rural economies, quietly, one farm at a time. “Depletion,” in what follows, often means that economic wall rather than a dry hole in the rock.
Consider the Indian Punjab, one of the subcontinent’s breadbaskets, which grows a tenth of India’s rice on water it lacks. Punjab now depends on tubewells for roughly 72 percent of its irrigated area, with canals supplying most of the remainder.554 And the tubewell is why the decline feeds on itself. As the water table falls at those rates, year after year, the shallow tubewells go dry, so farmers drill deeper ones and fit stronger pumps to chase the water down. Each round of deeper wells pulls harder on the same shrinking reserve. It is a race to the bottom with a literal bottom: in time, the water sits too deep to reach affordably, or it is simply gone.
In the Central Ground Water Board’s 2020 assessment, 117 of the state’s 150 groundwater-assessment blocks—78 percent—were classified as over-exploited, meaning that extraction exceeded the annually extractable resource.555 556
The most alarming projection is from a widely reported CGWB assessment finding that, if extraction continued at the prevailing rate, Punjab could exhaust its usable groundwater resources within the upper 300 meters by approximately 2039.556 The 300-meter figure was treated as a practical limit because groundwater at greater depths may be poorer in quality and prohibitively expensive for many farmers to extract.
That is within the working life of a farmer planting there today.
It is not one story but several, staggered across the plains. “Peak depletion” is the year an aquifer is drained fastest, the top of the pumping curve, the groundwater version of peak oil. After that year, the rate of loss begins to fall. That can sound like relief, but it is the opposite. The rate falls because the water is running out: as pumping thins the saturated layer, wells yield less, some run dry, and land drops out of irrigation, so exhaustion itself forces extraction down. Peak depletion is the last year of maximum water, the moment a place crosses from draining hard into a decline it cannot pump its way out of.
A 2016 modeling study reconstructed and/or projected peak depletion rates occurring in Texas in 1999, New Mexico in 2002, Kansas in 2010, Oklahoma in 2012, and Colorado in 2023, while Nebraska, South Dakota, and Wyoming were not projected to reach peak depletion before 2110.557 The Colorado date should therefore be understood as a model projection made in 2016, not as a subsequently verified observation.558 The deepest losses are concentrated in the central and southern aquifer, where decades of pumping have removed much of the accessible saturated thickness. In much of it, recharge replaces only a small fraction of what is pumped, so even if extraction stopped tomorrow, a full refill would take centuries.
The scale of it shows in two Kansas numbers. Close to a third of the High Plains groundwater there has already been pumped, and at the pace of recent years about seventy percent of it would be gone within fifty years—with the region’s farm output, which lags the pumping peak, projected to crest around 2040 and slide after that. The wells do not fail together. They fail county by county, on the schedule the water sets.559 560
These findings and projections repeat across the world’s most important farmland. The Indus Basin, feeding a region whose crops sustain well over a billion people, is among the most stressed aquifer systems on Earth.561 In the North China Plain, which grows a large share of China’s grain, the deep aquifer has fallen so far that the country built a continental-scale project to pipe water north: sustaining the breadbasket by moving water across the country rather than by any natural recharge.563 And across much of the Middle East and North Africa, the water being pumped is fossil water, laid down in wetter ages tens of thousands of years ago, that effectively does not refill at all.564
The Folly of the Relationship Between Saudi Arabia… and Arizona
Every region in the preceding section is a clock still running. Now let’s look at one that has already stopped, because it shows two things at once: what running out looks like, and what a nation does the morning after.
Saudi Arabia used ancient, nonrenewable fossil groundwater to pursue wheat self-sufficiency, then began phasing out domestic wheat production in 2008 as concern grew over depletion of its water reserves; the program ended in 2016.565 By the time that program ended, experts estimated that about four-fifths of the country’s fossil water was already gone, spent in little more than a single generation of pumping.565 The same water demand later reappeared overseas. Fondomonte, a subsidiary of the Saudi dairy company Almarai, has used groundwater in western Arizona to grow alfalfa for livestock in Saudi Arabia, and in 2026 it remained a major groundwater user in the state.566 567 It is an unusually literal example of “virtual water”: instead of pumping scarce water at home, a company draws water abroad, embeds it in a crop, and ships the crop back.
That maneuver is worth looking at closely, because it is the first move any country makes when its own water fails, and because it cannot work for very many of them. It depends on somewhere else having water to spare and a government willing to let it leave. Saudi Arabia could take it because it went first, while most of the world’s aquifers were still full. The country that runs dry last will find every well already spoken for. This is the wall this chapter keeps arriving at: you cannot redistribute your way out of a shortage that is draining the very places the surplus would have come from. So Saudi Arabia is the first country to reach 2050 ahead of schedule. It found a way out. The countries that arrive after it will not.
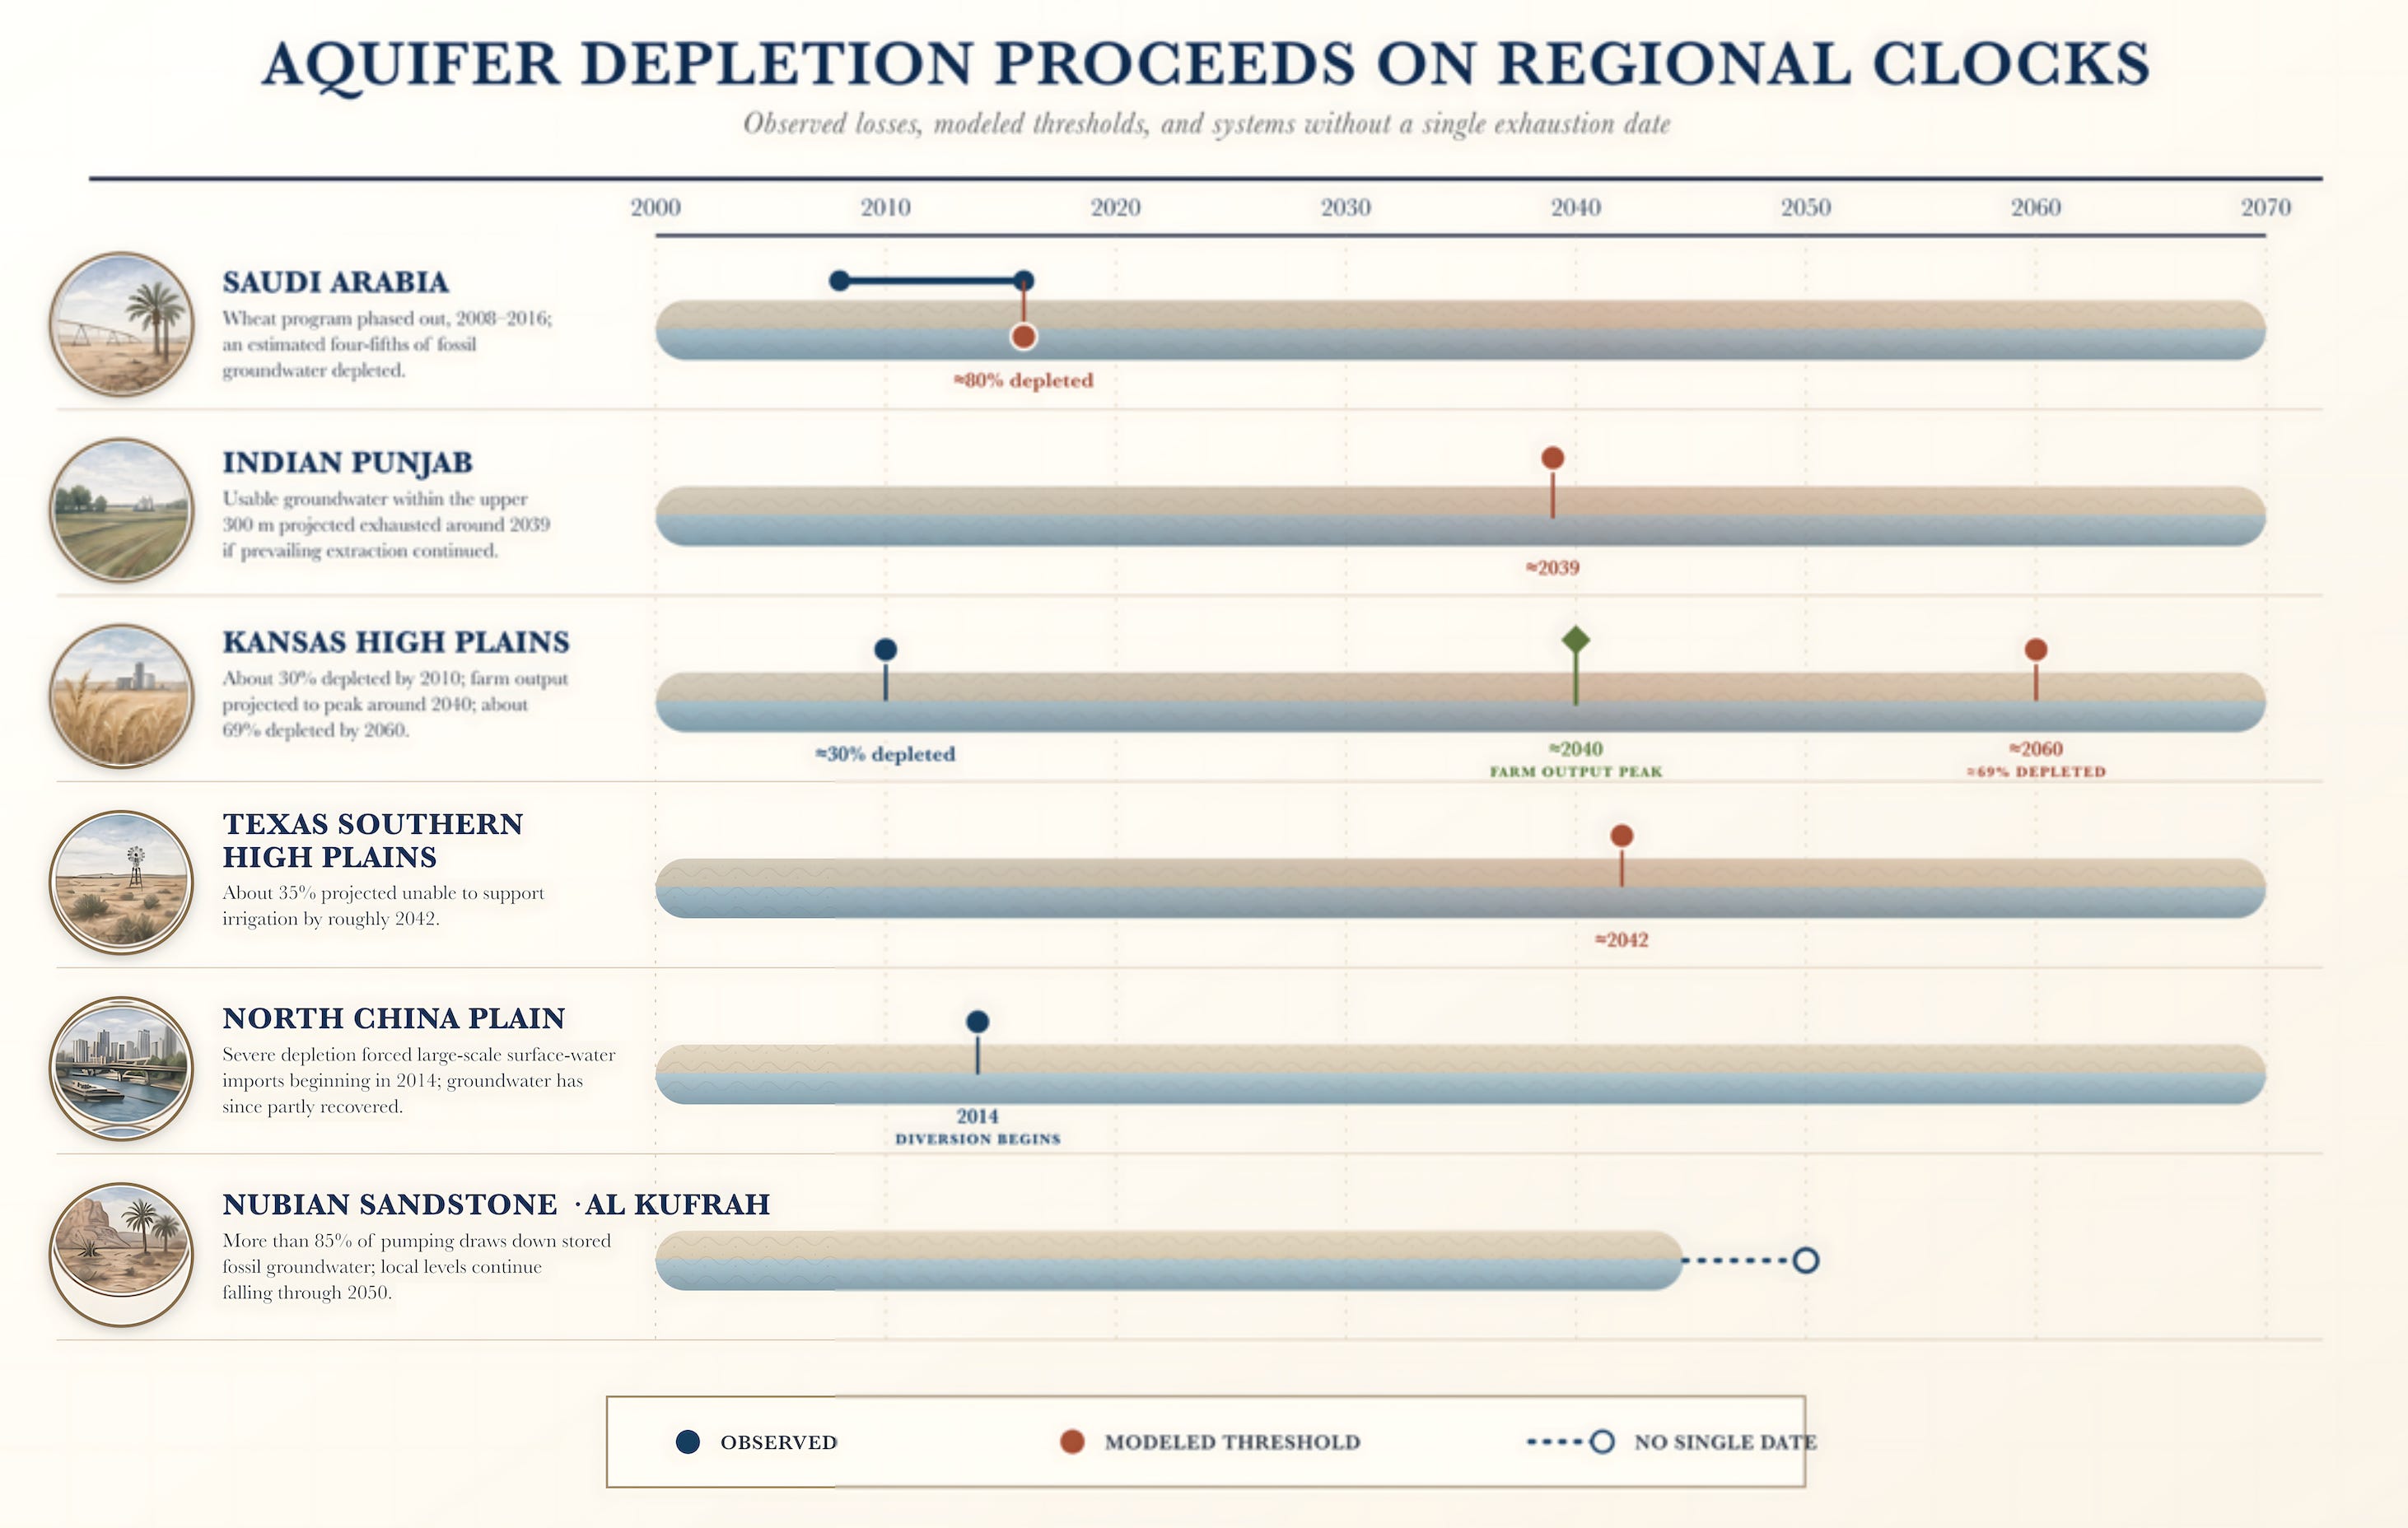
Figure 46.5. Regional trajectories of major groundwater-dependent agricultural systems
Linear Yield Gains, Falling Percentages
Return to the silence, because the numbers now explain it. When people imagine a yield failure, they imagine a collapse, a harvest that does not come in. A slope that is only flattening does not alarm anyone.
The deeper reason the shortfall stays invisible is in how a harvest gets reported. Yields grow in a straight line — the same tonnage added each year — and that tonnage reliably sets new records, so headlines announce progress while the growth rate quietly falls. Nobody reads about declining rates. Everybody reads about record crops. The mathematics launders a crisis into a success story.
What the numbers actually show is simpler: wheat is adding grain at roughly a third of the annual rate needed to reach 2050. Rice at about forty percent. Maize and soybean closer to two-thirds, but still short. These are not optical illusions — the target was set in tonnes to begin with. We are hitting between a third and two-thirds of it, depending on the crop, and the gap grows every year we celebrate the record without noticing what it falls short of.
Recall from Figure 46.3 above that annual rice yield increases were the lowest of the four staples, now rising at only 0.63% a year. Rice is the thirstiest staple we grow, the one crop that spends much of its life standing in water. If the disturbance beneath modern agriculture is a slow degradation of the water itself, this is the fingerprint it would leave: the crop that relies most on water is growing the least. One pattern does not prove a mechanism. But this is the pattern the mechanism predicts, and it is the one the data shows.
Where the arithmetic might have forced its way into view, a set of buffers has absorbed it. A short harvest in one country is covered by exports from another. Governments draw down reserves. Farmers irrigate harder, spread more fertilizer, and break new ground. Each move keeps the shelves stocked, and for fifty years each one kept the price falling too, while quietly billing the difference to something that never appears on the receipt: the aquifer and the soil. Then the price stopped falling. It is the one place the buffers have visibly failed, and it failed first, before a single major aquifer had given out. The buffers do not solve the yield problem. They convert it into a slower, larger debt, drawn against the very resources this book has spent its chapters watching drain away. That is Hemingway’s bankruptcy in a sentence. Gradually, while the reserves hold. Then suddenly, when they do not. The price is where the “gradually” ran out.
China’s Food Security Law
If this danger were imaginary, the government with the most people to feed and the least room to fail would be the calmest of all. China is the opposite. Its population has stopped growing and begun to fall, by more than three million in 2025 alone, yet its cropland is limited, its northern aquifers are stressed, and it leans on imported soybeans and feed grain to hold the balance.569 On its own farmland, the plateau is already evident: by 2010, yields had stopped improving across half of China’s rice area and more than half of its maize.570 Beijing’s own word for its food balance is “tight,” and it expects it to stay that way for a long time.571 So China has done what an alarmed state does. In 2024, it brought a national food security law into force. It draws legal redlines around farmland that cannot be paved, it is building high-standard cropland across hundreds of grain counties, and it has ordered its farms to add more than fifty million tonnes of annual production capacity by 2030.572 The country standing closest to the arithmetic is treating it as an emergency, while the countries with the most slack treat it as no story at all.
In other areas, pressures are building the hardest where the buffers are weakest. Across a set of representative sub-Saharan countries, cereal demand is projected to roughly triple by 2050, and even if yield gains double the historical rate and much of the gap to the ceiling is closed, they would still need more land, more water, and more imports.573 Where the wealthy world sees a smooth global average, a farmer in the Sahel meets the arithmetic head on.
Not a Climate Story
So is this just climate change by another name? The answer is no. Whatever one concludes about the climate debate, the forces driving this crisis are not carbon in the air. They are water pumped from the ground faster than it returns, soil worked past its power to recover, minerals stripped from the medium that feeds the crop, and a water chemistry turning against the plants it once sustained. None of these depend on the climate argument to be true, and none of them would relent if that argument were settled tomorrow. Our obsession with climate has obscured this crisis by reducing every environmental problem to a single problem with a single cause.
There is a term for what I am describing, and I did not have it when I wrote this chapter.
Hydrologists have begun using anthropogenic drought to name a deficit that is produced, or greatly deepened, by what people do to a water system rather than by what the sky withholds. The category is meant to contain the things that do not fit inside a rainfall record: over-allocation, groundwater drawn down past recovery, land cleared and evapotranspiration disrupted, irrigation expanded, rivers diverted, surface storage lost. Together these can turn a dry spell that a basin once absorbed into a shortage that does not lift when the rain returns.574
The framework’s own authors are careful about how far it can be pushed, and I want to be equally careful. This is a reframing, not a measurement. They say so: the feedbacks between climate, withdrawal and land use compound in ways that make the drivers difficult to disaggregate quantitatively. The concept establishes that a drought’s severity is partly authored by decisions. It does not yet let anyone say, in most places, by how much.
That limit does not weaken this chapter’s argument. It is the argument. A crisis that can be photographed and dated gets a name; one that has to be separated out of a tangle of human decisions does not, and so it goes on being filed under weather.
And it is the same paper that gave this chapter its title. Water bankruptcy is defined there as the state in which water shortage exists even during wet years.574 The term I found days before the printer turns out to have been sitting inside the literature on drought caused by us.
The convergence of slow changes in our water, soil, yields, and chemistry has many causes and a single victim. It has no stage, and no number dramatic enough to fit on a placard. But every one of those changes, the pumping that empties the aquifer, the soil worked past recovery, the minerals stripped from the medium, the chemistry souring against the crop, comes to rest in the end on the same place: the water beneath it all, the medium the whole living system depends on. A crisis with many causes still has one name, and that name is on the cover of this book. The loudest dangers are not always the largest. This one has kept its silence because it is arithmetic, not an event, adding a little more to the tally each year until the debt those small sums have run finally comes due.
The Books Do Not Balance
These failures will not arrive all at once. Punjab will run down on one clock, the southern Ogallala on another, the fossil aquifers on a timer that will never reset. That fragmentation is precisely why the crisis remains difficult to see. Each decline appears local, each shortage temporary, each emergency isolated. Yet together they describe a single global pattern.
Set aside every contested projection and every debate over dates. What remains is remarkably simple. Across much of the world’s most productive farmland, yield growth is slowing or has begun to flatten even as demand continues to rise. At the same time, an increasing share of global food production depends on groundwater being withdrawn faster than nature can replace it. We are balancing today’s harvest against tomorrow’s water. A meaningful portion of the world’s apparent agricultural success is being financed by drawing down a finite natural inheritance. The books do not balance.
This is why the central argument of this chapter is not about 2050. The trajectory is already visible. Some aquifers have passed their peak. Others are declining within the working lifetime of farmers planting crops today. The instruments that revealed these changes were not built just so researchers could write frightening papers; they were built to measure reality. Their collective message is neither political nor speculative. They are simply saying that the margin between the water we depend upon and the water we are replacing is steadily narrowing.
I do not raise this to despair. I raise it because the only thing that can convince a world to try to bend a curve is to look straight at where it goes if you do not.
I then lay out a path toward bending those curves in the remainder of the book. Cliffhanger, I know.

You can purchase the series, in whole or in part, from my website here or from Amazon here.
Fun fact before I close: for a brief stretch after release, Earth’s Living Water was the #1 New Release in Agronomy, and The Silent Aquifer was the #1 New Release in Regenerative Agriculture.
Who woulda thunk it? An ICU doctor. Topping the agronomy charts. I’ll explain how that happened in my next post and it’s a stranger story than you think.
From the Shameless Commercialism Department:
I write about minerals and water. Midway through the writing of these books, I started a company that sells an aqueous mineral solution of the two.
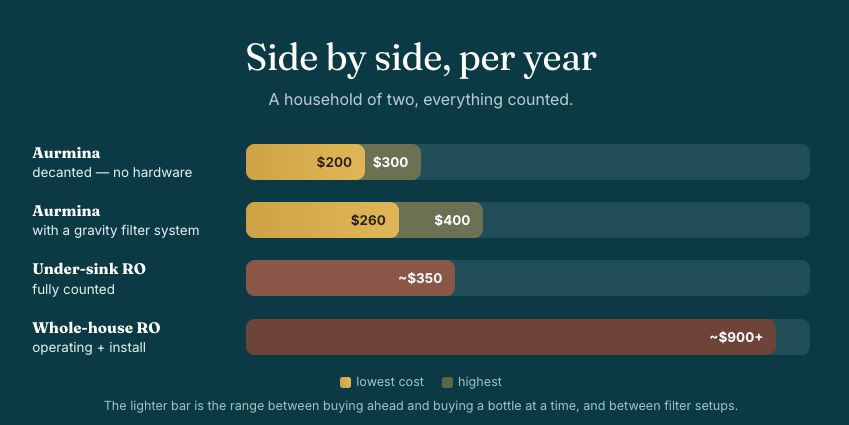
Aurmina is the provable, superior, and less expensive alternative to reverse osmosis for purifying drinking water. It binds and removes over 245 modern contaminants—and unlike RO, it balances minerals, builds hydration shells, restores redox activity, and increases ion-exchange capacity in your water—the exact opposite of stripping it empty and calling it clean. Labor Day sale starts today; use code LABORDAY25.
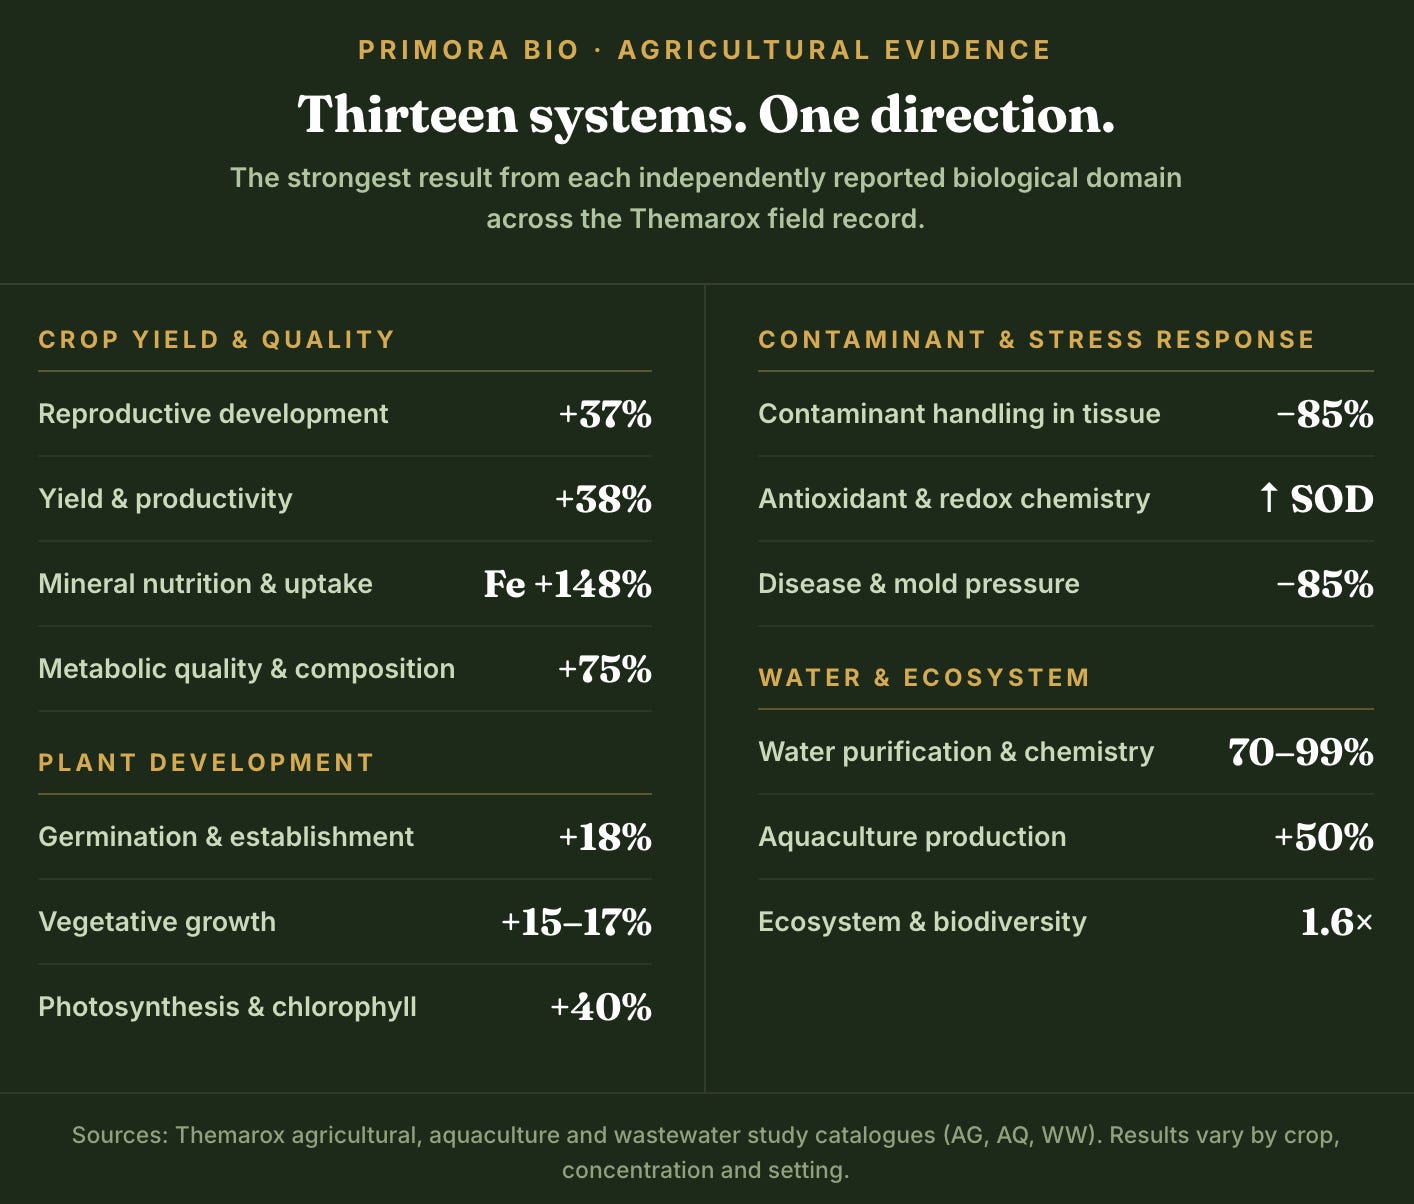
Primora Bio relies on the same mineral chemistry for the water that supports the things we grow and love: plants, gardens, fish, and pets.
And finally… a few pictures of baby Lazlo, or “Latzee” as we call him; the first is a passport photo attempt:



Great article, thank you … Lazlo is beautiful and the dimples !!! Love it God Bless you and the family.🩷🩵💙
I spend my days always looking for healthy safe alternatives to drugs - thanks to physicians like you - my daughter Niki was vax injured by the rabies series (which was a necessity) the very week Covid was made public - she now has neurological problems - twitches - documented - in my search for help I found RFK Jr. , you and Dr. Marik and Dr. McCullough and Children's Health defense. I feel God has given us all we need - we just have to find what works. Thank you for all you did and sacrificed. You treated one of my daughter's friend's mother who was institutionalized - I received a note from her I saved thanking me for referring you to her - you saved her life.